From Development to Delivery: Key Results of the Second Project Phase

by | Nov 5, 2025 | URBAN FOOD | 0 comments

Following the successful completion of the initial development phase, the second project phase marked a decisive step forward — transforming a solid digital foundation into a fully integrated, tested, and delivered IoT solution.

Between April and October 2025, Biota and its development partner X Logic d.o.o. focused on system integration, testing, optimization, and final delivery, bringing the platform closer to real-world deployment and commercial use.

Seamless Integration with Sensor Systems

One of the most important achievements of this phase was the development of a dedicated integration interface connecting the IoT application platform with external sensor systems.

Web interface

Using industry-standard technologies such as REST APIs and MQTT, the platform now enables reliable, real-time data exchange between hardware and software components. All integrations were fully documented, ensuring long-term maintainability and scalability.

From Testing to Real-World Validation

Once integration was completed, the system entered an intensive testing phase:

  • internal functional and integration testing of both web and mobile applications,

  • creation of structured test cases and identification of potential issues,

  • targeted corrections, optimizations, and performance improvements.

This process significantly increased system stability, reliability, and overall user experience.

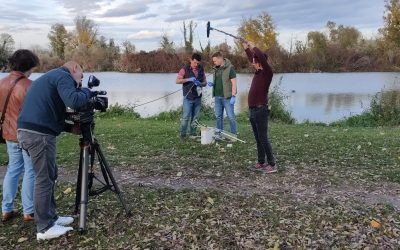
Testing Together with Users

A key milestone was joint testing with end users, where real-world usage scenarios were simulated. Feedback collected during this phase led to final refinements and resulted in preliminary approval of the system, confirming that the platform meets practical needs and expectations.

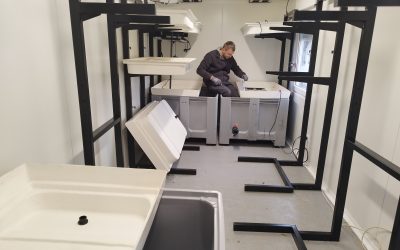
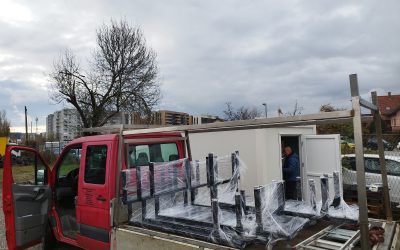
Ready for Deployment

The final stage focused on preparing the solution for delivery:

  • complete technical documentation,

  • packaged mobile applications for Android and iOS,

  • archived and handed-over source code,

  • a final presentation showcasing system capabilities and use cases.

With the successful final delivery and presentation, the second project phase officially concluded, marking the completion of a fully functional IoT platform ready for operational use.

Looking Ahead

This phase bridged the gap between development and deployment. The platform is now not only technically complete but also tested, validated, and ready for further scaling, commercial rollout, and future feature expansion.

The results achieved demonstrate how structured development, close collaboration, and iterative testing can turn complex digital concepts into reliable, real-world solutions.

So, you’ve tromped through the wind farm, sunburnt and smelling like sweat and crushed sagebrush. You’ve got a clipboard full of carcass locations, trial mice, and days of search effort under your belt. Now what?

Now comes the real magic: turning your field notes into hard numbers — and that’s where the Fatality Estimator and GenEst tools come in. These are not just some dusty spreadsheets; they’re statistically robust, government-backed, field-tested software packages that help you go from “we found 3 bats” to “we estimate 48.6 bats were killed this season, with a 95% confidence interval.” Sounds fancy — and it is.

But first, let’s go back to the start…


Setting Up the Fieldwork – You Can’t Model What You Don’t Measure

Before you even think about loading data into a computer, you need to run what’s basically a statistical calibration exercise disguised as fieldwork. This is where bat biologists get creative.

They take small carcasses — often mice, which are close enough in body mass and visual detectability to bats — and scatter them around the turbines like biological easter eggs. Another person then walks the site pretending it’s a real survey, without knowing where the “planted” bodies are. This gives you the Searcher Efficiency: the percentage of carcasses a human (or dog!) can actually detect under field conditions.

Some carcasses are left in the field over time, with checks every few days. This tells you how long they stick around before scavengers, weather, or rot make them vanish — aka Carcass Persistence.

Without these two calibrations, your actual survey data is mostly vibes and guesswork. But with them? You can start telling a story with real statistical teeth.


Using the Fatality Estimator: Old-School, Reliable

Let’s start with the OG tool — the Fatality Estimator. It’s a standalone Windows program developed by the USGS. It’s a little clunky, but like a good 4×4, it’ll get you there if you treat it right.

Here’s how the workflow looks:

  • 📁 Prepare your data in .CSV files with strict formatting rules: comma-delimited, no stray characters, and dates in MM/DD/YYYY format. Any wrong semicolon or non-English letter in a file path? Boom — it crashes.

  • 🧪 You need three input tables:

    • Fatality data: each carcass found, when, where, what species.

    • SE trial data: when you planted your test mice and whether they were found.

    • CP trial data: how long each carcass lasted in the field.

  • 🧪 Start by doing a test run with 1 bootstrap to check if everything loads. If it runs, you’re golden.

  • 🚀 Then launch the real analysis with 5,000 bootstraps. This gives you robust confidence intervals on mortality estimates.

It’s picky. If your “visibility” covariate only has one level, or your dates are out of order, or your turbine names aren’t exactly the same in every table — the software will throw a tantrum. But once you get past the tantrums? You’ve got mortality estimates you can put in a peer-reviewed paper.

📝 Pro Tip: If you found fewer than 5 carcasses, the tool recommends switching to the Evidence of Absence software (EoA) — but you can also just… go back and search a bit more if that’s logistically possible. Trust me, it’s easier than EoA.


Enter GenEst – The R-Powered Upgrade

GenEst is the younger, smarter sibling of the Fatality Estimator — built in R and backed by the USGS again. It’s shinier, more flexible, and comes with a Shiny App GUI that makes your browser feel like mission control.

Step-by-step, this is how you do it:

  1. 💻 Install R & RStudio (if you haven’t already).

  2. 📦 Run: install.packages("GenEst", dependencies = TRUE)

  3. 📂 Organize your project folder: everything goes in .csv, decimal separator must be . and not ,.

  4. 🧠 Launch GenEst: GenEst() or runGenEst() from the R console.

  5. 🧾 Upload these 4 key files in the app:

    • CO (Carcass Observations) – when/where bats were found.

    • SE (Searcher Efficiency) – your test mouse data.

    • CP (Carcass Persistence) – how long they lasted.

    • SS (Search Schedule) – what turbine was searched on what date.

Now you step through the interface, left to right:

  • SE tab: Select the right columns (s1, s2, s3…), run the model, and download the output.

  • CP tab: Choose date columns, run survival models (Weibull is a good start), download again.

  • Mortality Estimation: Select your SE/CP models, enter how many turbines were surveyed vs. total, and hit “Estimate”.

Each time, GenEst gives you beautiful plots, detection probabilities, and — most importantly — estimated fatalities with confidence intervals.

You can even go wild and break it down by species, turbine, season, or visibility class. Want to know which turbine is your bat-killer hotspot? GenEst will tell you.


Final Tips Before You Rage-Quit

  • Keep your turbine names identical across all files (t12 ≠ T12 ≠ t012).

  • Make sure dates are in U.S. format (MM/DD/YYYY) and in order.

  • Don’t use semicolons or funny characters — this thing hates Croatian encoding quirks like č, ć, š, ž, or đ in folder names.

  • Always test with 1 bootstrap before running 5,000. Saves you headaches.


From Field Boots to Confidence Intervals

These tools — Fatality Estimator and GenEst — are the real deal. They’re not just statistical busywork; they let you tell a defensible story about wildlife mortality in the age of renewable energy. It’s where field biology, ecology, and data science collide.

And the best part? Once you’ve done it a few times, it starts to feel like magic. You go from “here’s a list of carcasses” to “here’s the real-world impact of our infrastructure — with math to back it up.”

That’s the kind of story regulators, conservationists, and wind companies need to hear.

Written by Dusan Jelic

Related Posts

0 Comments